Number of Med Spas in the US 2026 (Live Counter)
Counting medical spas in the U.S. is not straightforward. Businesses offering medical-aesthetic treatments may be listed as skin-care clinics, laser centers or wellness centers, while published estimates differ in which businesses they include and when they counted them.
The U.S. Med Spa Market Study 2026 by SANOR provides an updated estimate of operating locations and a forecast of annual revenue. The results suggest a larger market than some industry figures imply, with the number of locations growing faster than forecast average revenue per location.
Key Findings
- Number of med spas: The U.S. has 26,171 operating med spa locations as of September 2026, according to SANOR.
- Growth: U.S. med spa locations increased 17% from 2025 to 2026, rising from 22,368 to 26,171—an additional 3,803 locations.
- Revenue: Surveyed med spa locations forecast average annual revenue of $1.13 million for 2026, approximately 2% above their reported 2025 average of $1.11 million.
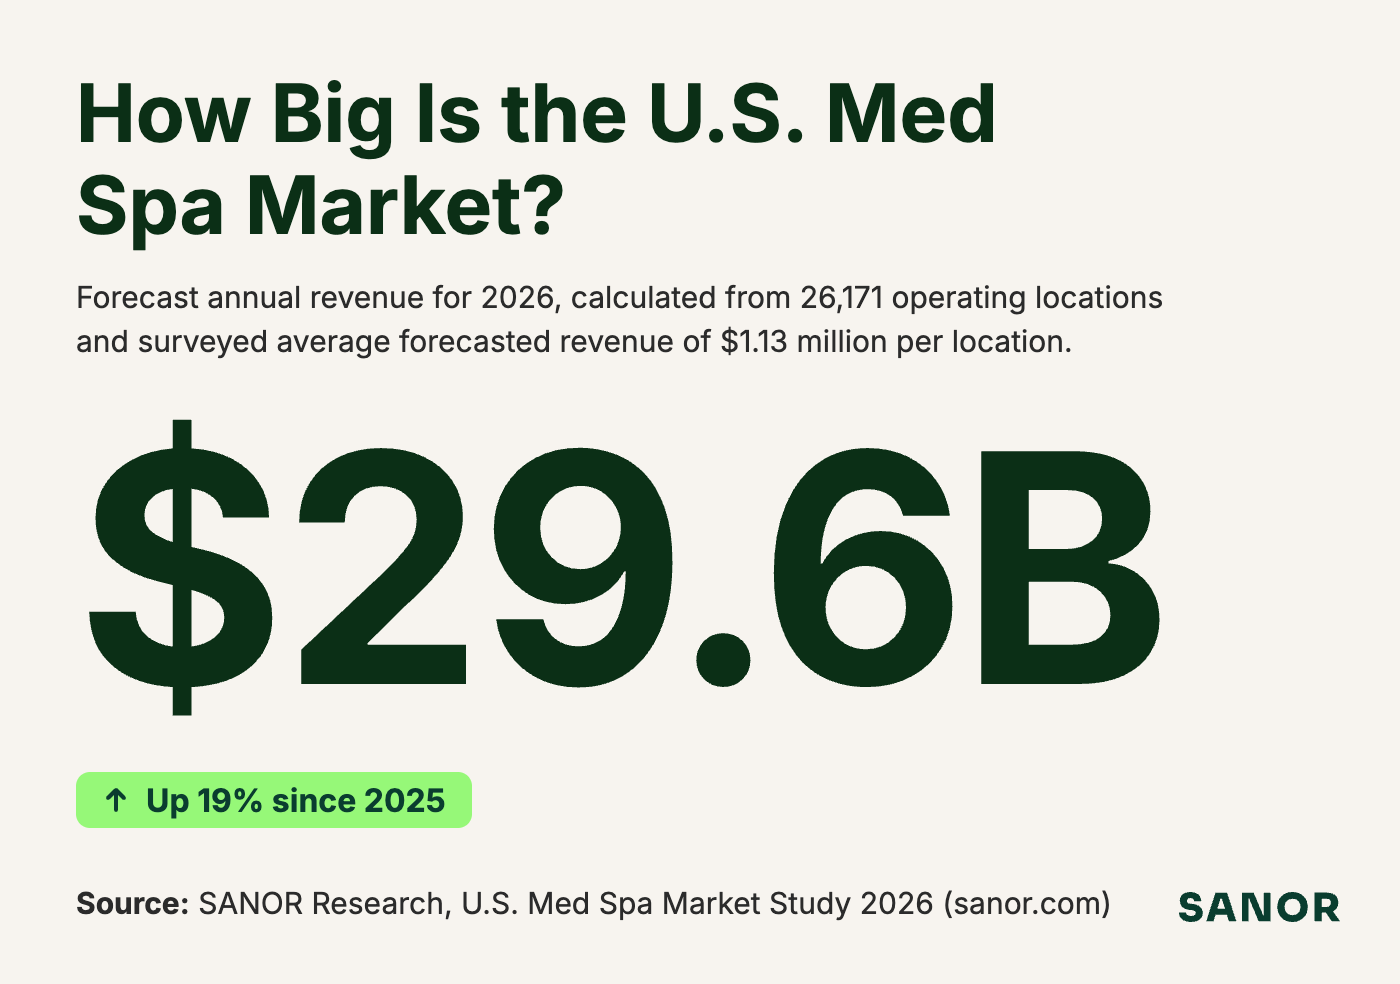
- Market size: SANOR forecasts U.S. med spa market revenue of $29.6 billion in 2026.
- Competition: The U.S. med spa market may be entering a more competitive phase, as location growth outpaces the forecast increase in average revenue per location.
Number of Med Spas in the U.S.
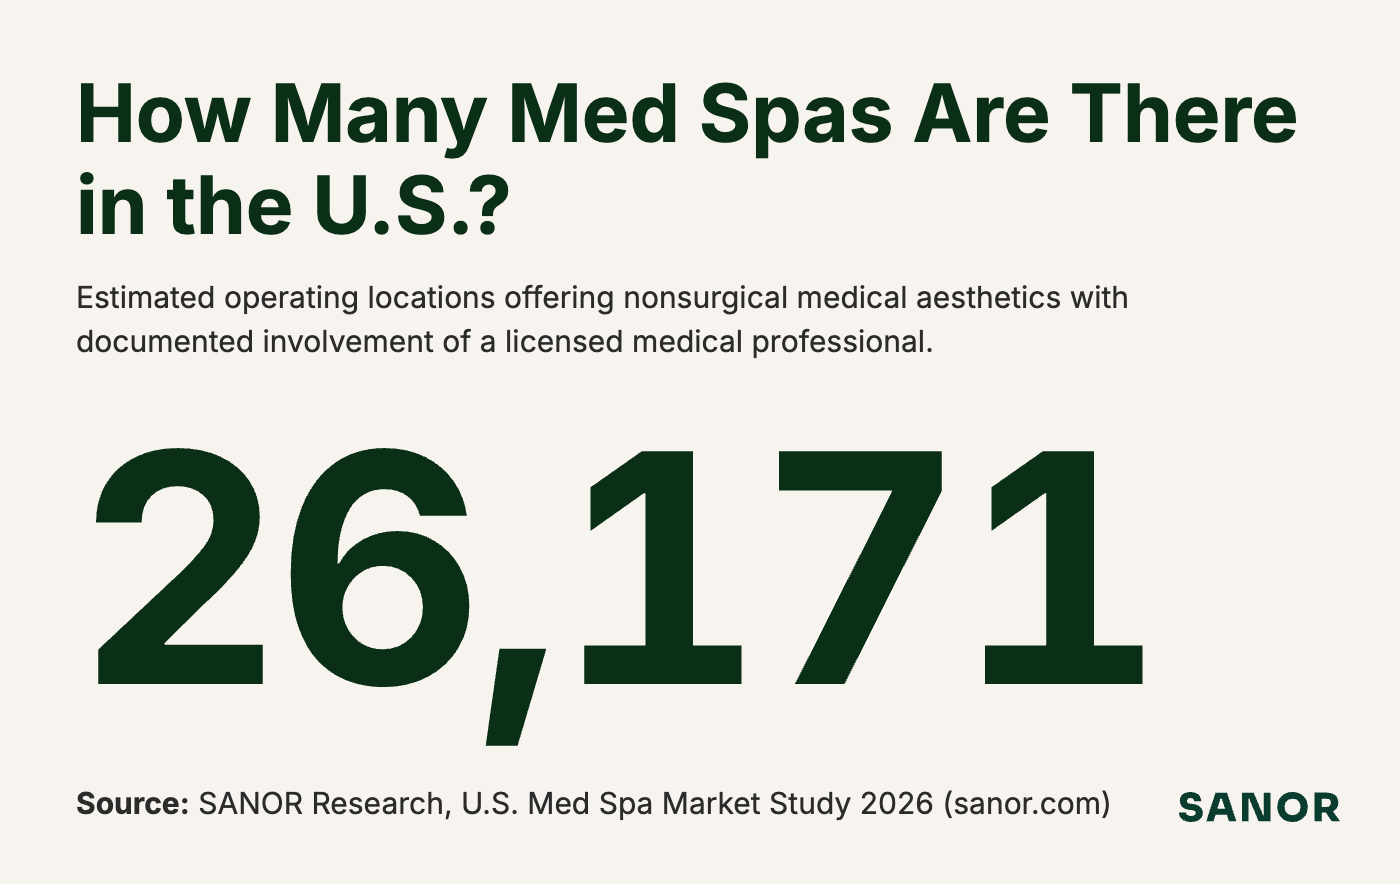
There are 26,171 med spas in the U.S.
SANOR’s September 2026 count puts the number of operating U.S. med spa locations at 26,171, up from 22,368 in 2025—an increase of 3,803, or 17%. The two counts use comparable definitions, coverage and estimation methods.
The count includes individual locations of multi-location businesses. Each establishment must meet our treatment-based definition and have documented involvement from a licensed medical professional.
Published estimates offer different views of the market
AmSpa’s 2024 report put the number of U.S. med spas at 10,488 in 2023. Its June 2024 release also described an industry with more than 11,000 locations.
These figures remain useful benchmarks, but their reference dates matter when assessing the market today. AmSpa’s report recap, June 2024 release
| Source | Reported U.S. med spa locations | Reference date |
|---|---|---|
| AmSpa, 2024 industry report | 10,488 | 2023 |
| AmSpa, announcement of the same 2024 report | More than 11,000 | June 2024 announcement |
| SANOR, U.S. Med Spa Market Study 2026 | 26,171 | September 2026 |
SANOR revisited the count to provide a current estimate based on research into individual establishments. We combined company directories, Google Places and manual review, applying consistent qualification rules to businesses listed across several categories.
This approach differs from AmSpa’s owner-survey research. Differences in coverage, definitions and dates could account for part of the gap between the estimates; the comparison alone cannot determine how much reflects market growth.
Med Spas by State
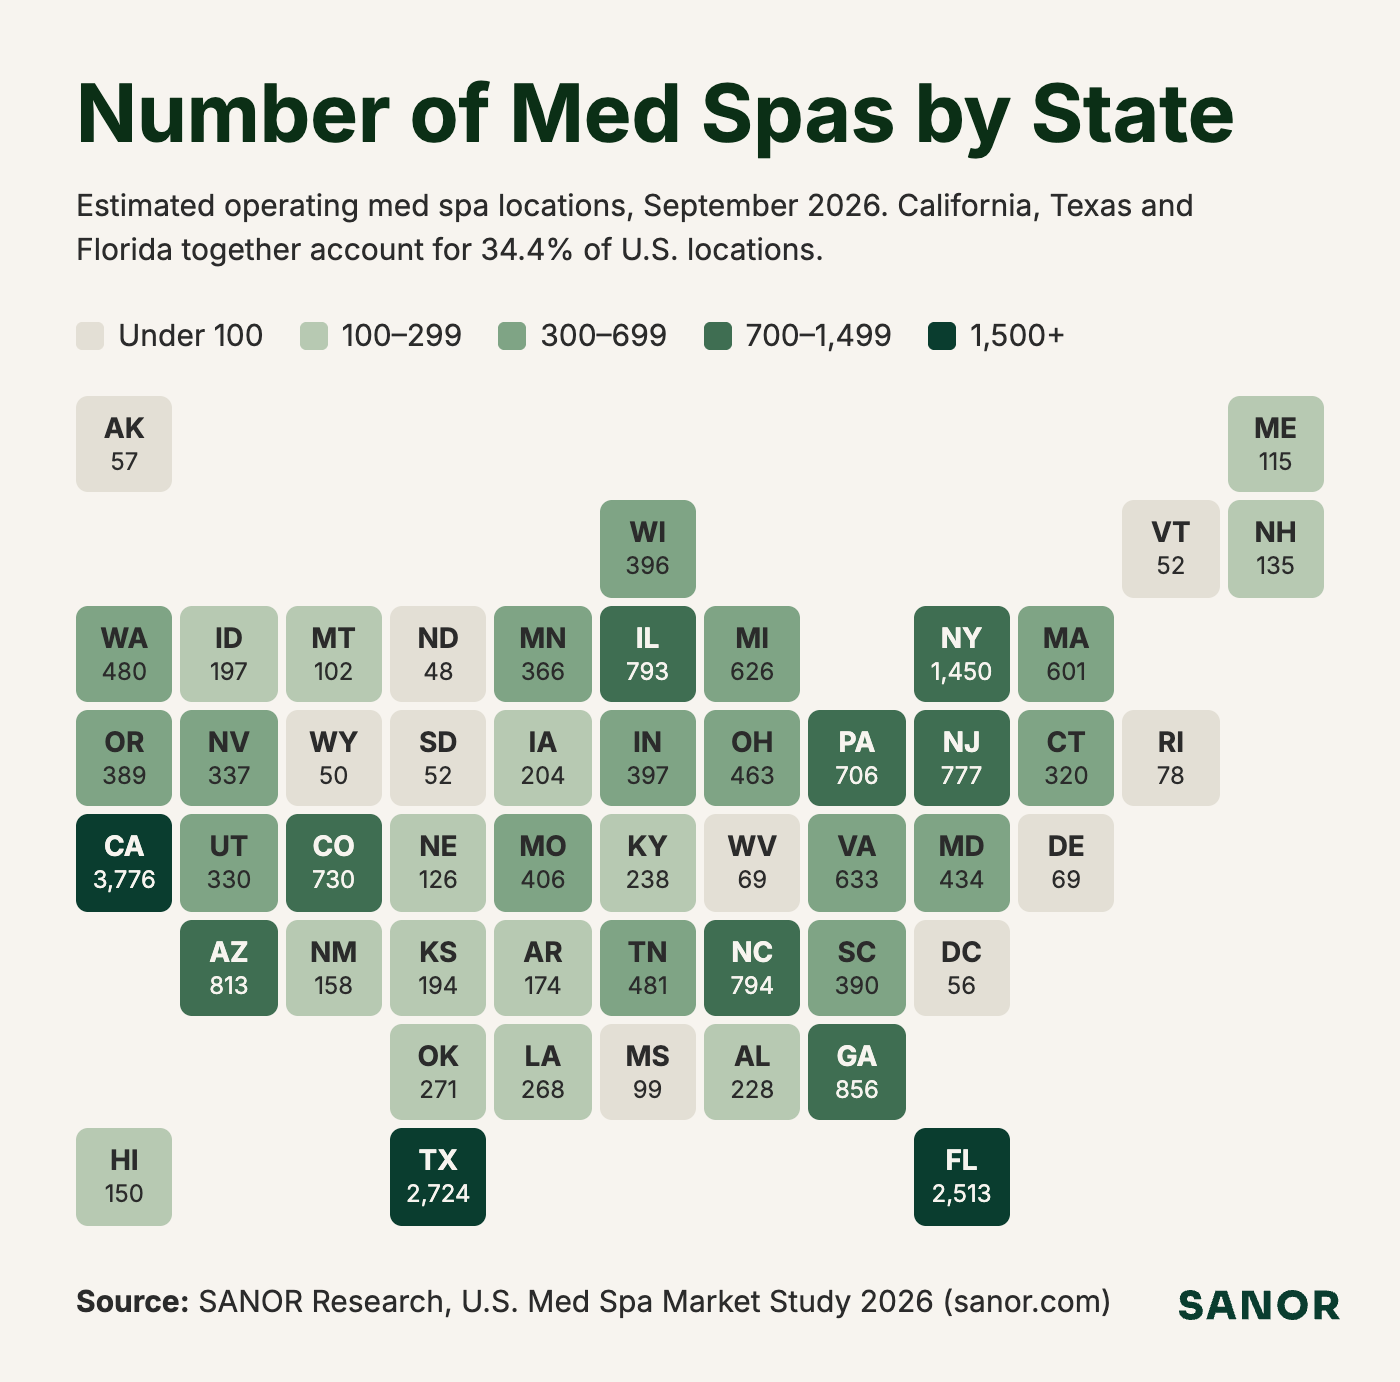
California has the most med spas, followed by Texas and Florida
California has 3,776 med spa locations, followed by Texas with 2,724 and Florida with 2,513. Together, these three states account for 34.4% of U.S. med spas—just over one in three.
The ten largest state markets contain 58.2% of U.S. locations. The following ranking covers all 50 states and the District of Columbia as of September 2026.
Show all 50 states and D.C.Hide table
| Rank | State or district | Estimated med spa locations | Share of U.S. locations |
|---|---|---|---|
| 1 | California | 3,776 | 14.43% |
| 2 | Texas | 2,724 | 10.41% |
| 3 | Florida | 2,513 | 9.60% |
| 4 | New York | 1,450 | 5.54% |
| 5 | Georgia | 856 | 3.27% |
| 6 | Arizona | 813 | 3.11% |
| 7 | North Carolina | 794 | 3.03% |
| 8 | Illinois | 793 | 3.03% |
| 9 | New Jersey | 777 | 2.97% |
| 10 | Colorado | 730 | 2.79% |
| 11 | Pennsylvania | 706 | 2.70% |
| 12 | Virginia | 633 | 2.42% |
| 13 | Michigan | 626 | 2.39% |
| 14 | Massachusetts | 601 | 2.30% |
| 15 | Tennessee | 481 | 1.84% |
| 16 | Washington | 480 | 1.83% |
| 17 | Ohio | 463 | 1.77% |
| 18 | Maryland | 434 | 1.66% |
| 19 | Missouri | 406 | 1.55% |
| 20 | Indiana | 397 | 1.52% |
| 21 | Wisconsin | 396 | 1.51% |
| 22 | South Carolina | 390 | 1.49% |
| 23 | Oregon | 389 | 1.49% |
| 24 | Minnesota | 366 | 1.40% |
| 25 | Nevada | 337 | 1.29% |
| 26 | Utah | 330 | 1.26% |
| 27 | Connecticut | 320 | 1.22% |
| 28 | Oklahoma | 271 | 1.04% |
| 29 | Louisiana | 268 | 1.02% |
| 30 | Kentucky | 238 | 0.91% |
| 31 | Alabama | 228 | 0.87% |
| 32 | Iowa | 204 | 0.78% |
| 33 | Idaho | 197 | 0.75% |
| 34 | Kansas | 194 | 0.74% |
| 35 | Arkansas | 174 | 0.66% |
| 36 | New Mexico | 158 | 0.60% |
| 37 | Hawaii | 150 | 0.57% |
| 38 | New Hampshire | 135 | 0.52% |
| 39 | Nebraska | 126 | 0.48% |
| 40 | Maine | 115 | 0.44% |
| 41 | Montana | 102 | 0.39% |
| 42 | Mississippi | 99 | 0.38% |
| 43 | Rhode Island | 78 | 0.30% |
| 44 | Delaware | 69 | 0.26% |
| 45 | West Virginia | 69 | 0.26% |
| 46 | Alaska | 57 | 0.22% |
| 47 | District of Columbia | 56 | 0.21% |
| 48 | South Dakota | 52 | 0.20% |
| 49 | Vermont | 52 | 0.20% |
| 50 | Wyoming | 50 | 0.19% |
| 51 | North Dakota | 48 | 0.18% |
| United States | 26,171 | 100% |
Rankings use unrounded estimates. Shares are calculated from published location counts and may not sum to 100% due to rounding.
Med Spas per Capita
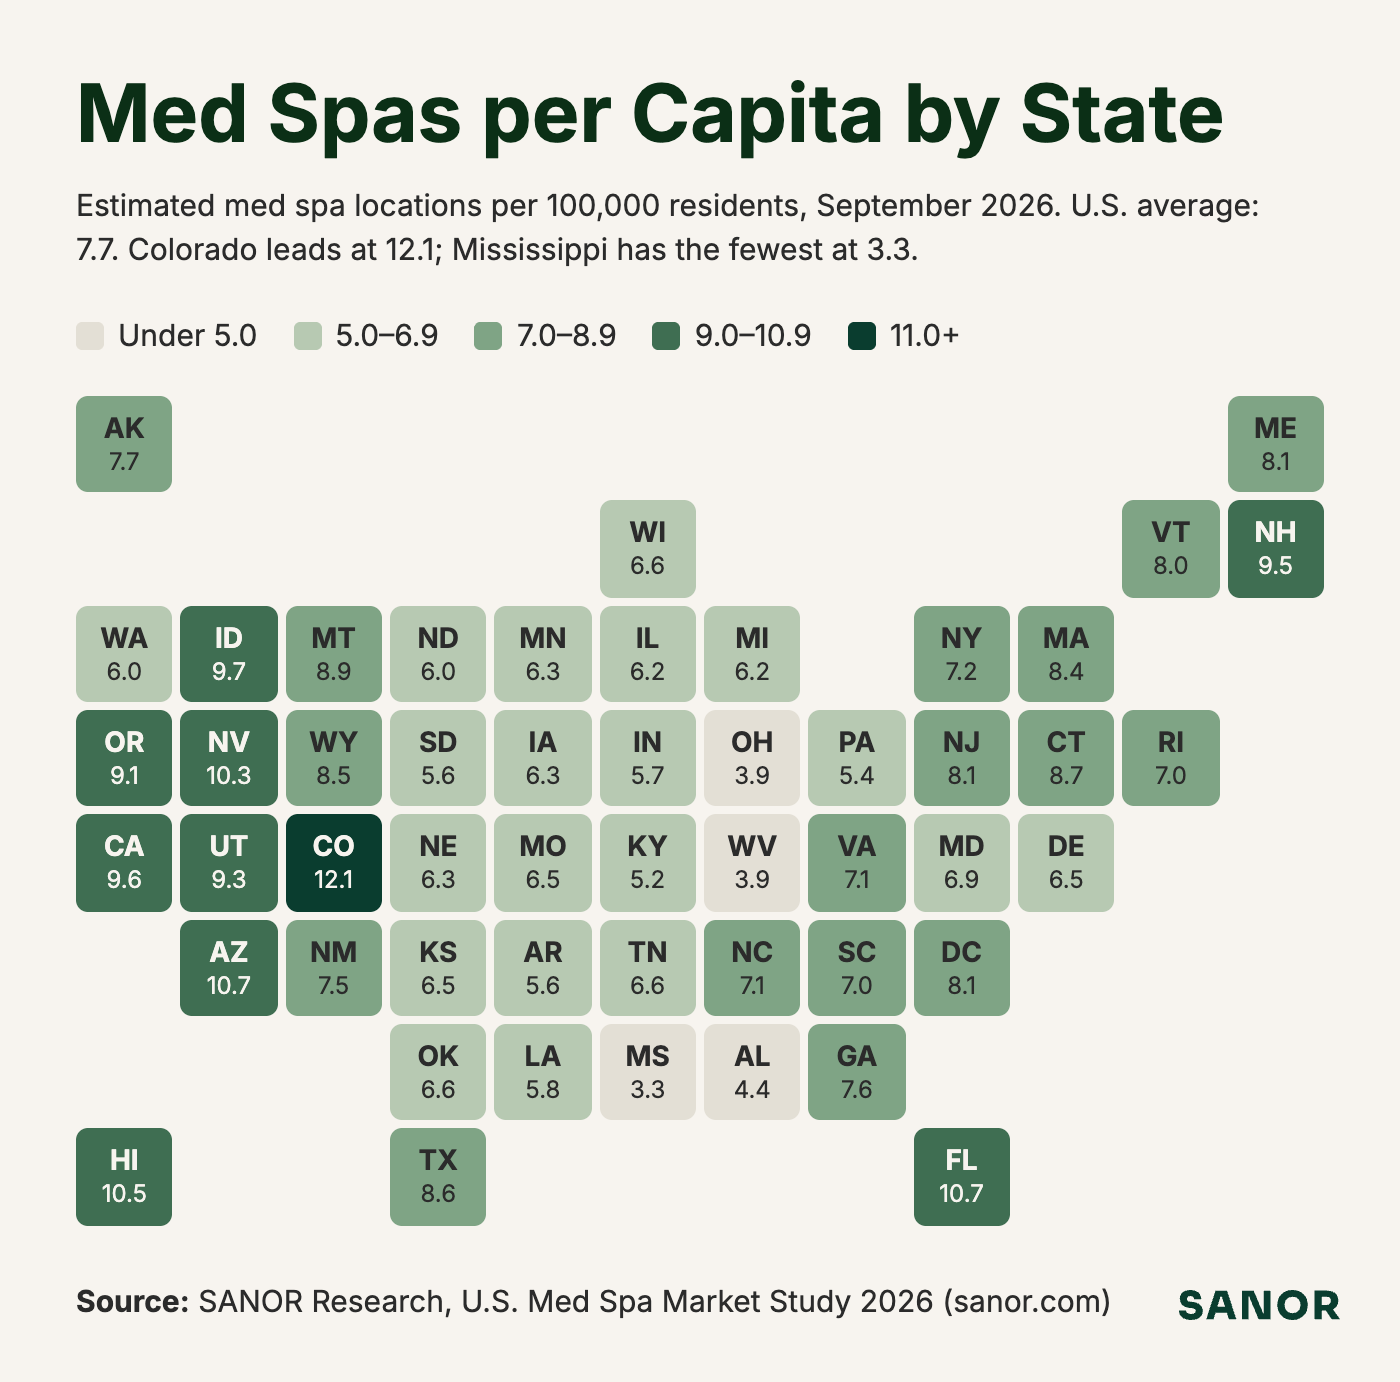
Colorado has the most med spas per resident
Colorado has 12.1 med spas per 100,000 residents, compared with the national average of 7.7. Florida and Arizona follow at 10.7 each.
Population adjustment changes the rankings. California leads in total locations but ranks seventh per capita; Colorado ranks tenth by location count and first relative to its population.
Show all 50 states and D.C.Hide table
| Rank | State | Med spas per 100,000 residents |
|---|---|---|
| 1 | Colorado | 12.1 |
| 2 | Florida | 10.7 |
| 3 | Arizona | 10.7 |
| 4 | Hawaii | 10.5 |
| 5 | Nevada | 10.3 |
| 6 | Idaho | 9.7 |
| 7 | California | 9.6 |
| 8 | New Hampshire | 9.5 |
| 9 | Utah | 9.3 |
| 10 | Oregon | 9.1 |
| 11 | Montana | 8.9 |
| 12 | Connecticut | 8.7 |
| 13 | Texas | 8.6 |
| 14 | Wyoming | 8.5 |
| 15 | Massachusetts | 8.4 |
| 16 | New Jersey | 8.1 |
| 17 | Maine | 8.1 |
| 18 | District of Columbia | 8.1 |
| 19 | Vermont | 8.0 |
| 20 | Alaska | 7.7 |
| 21 | Georgia | 7.6 |
| 22 | New Mexico | 7.5 |
| 23 | New York | 7.2 |
| 24 | Virginia | 7.1 |
| 25 | North Carolina | 7.1 |
| 26 | Rhode Island | 7.0 |
| 27 | South Carolina | 7.0 |
| 28 | Maryland | 6.9 |
| 29 | Wisconsin | 6.6 |
| 30 | Tennessee | 6.6 |
| 31 | Oklahoma | 6.6 |
| 32 | Delaware | 6.5 |
| 33 | Kansas | 6.5 |
| 34 | Missouri | 6.5 |
| 35 | Iowa | 6.3 |
| 36 | Minnesota | 6.3 |
| 37 | Nebraska | 6.3 |
| 38 | Illinois | 6.2 |
| 39 | Michigan | 6.2 |
| 40 | Washington | 6.0 |
| 41 | North Dakota | 6.0 |
| 42 | Louisiana | 5.8 |
| 43 | Indiana | 5.7 |
| 44 | South Dakota | 5.6 |
| 45 | Arkansas | 5.6 |
| 46 | Pennsylvania | 5.4 |
| 47 | Kentucky | 5.2 |
| 48 | Alabama | 4.4 |
| 49 | West Virginia | 3.9 |
| 50 | Ohio | 3.9 |
| 51 | Mississippi | 3.3 |
| — | United States average | 7.7 |
Mississippi has the fewest med spas per resident
Mississippi has 3.3 med spas per 100,000 residents, followed by Ohio and West Virginia at 3.9 each.
Ohio illustrates the distinction between market size and density: it ranks seventeenth in total locations but has one of the lowest population-adjusted rates.
These comparisons measure the concentration of establishments. They do not establish whether a market is underserved or saturated; local demand, customer spending and clinic capacity also matter.
Rates use September 2026 establishment estimates and U.S. Census Bureau population estimates for July 1, 2025. Rankings include all 50 states and the District of Columbia and use unrounded rates.
Regional Distribution of Med Spas
The South accounts for nearly four in ten U.S. med spas
The South has 10,295 med spa locations, representing 39.3% of the national total. The West follows with 7,572 locations, or 28.9%. Together, these two regions contain more than two-thirds of U.S. med spas.
| Region | Estimated med spa locations | Share of U.S. locations | Med spas per 100,000 residents |
|---|---|---|---|
| South | 10,295 | 39.3% | 7.7 |
| West | 7,572 | 28.9% | 9.4 |
| Northeast | 4,234 | 16.2% | 7.3 |
| Midwest | 4,070 | 15.6% | 5.8 |
| United States | 26,171 | 100% | 7.7 |
The West has the highest concentration relative to population
The West has 9.4 med spas per 100,000 residents, the highest rate among the four regions.
The South’s larger establishment count corresponds to a population-adjusted rate of 7.7, matching the national average. The Midwest has the lowest regional density, at 5.8.
Regions follow U.S. Census Bureau definitions. Rates use September 2026 establishment estimates and July 1, 2025 population estimates.
What Treatments Med Spas Offer
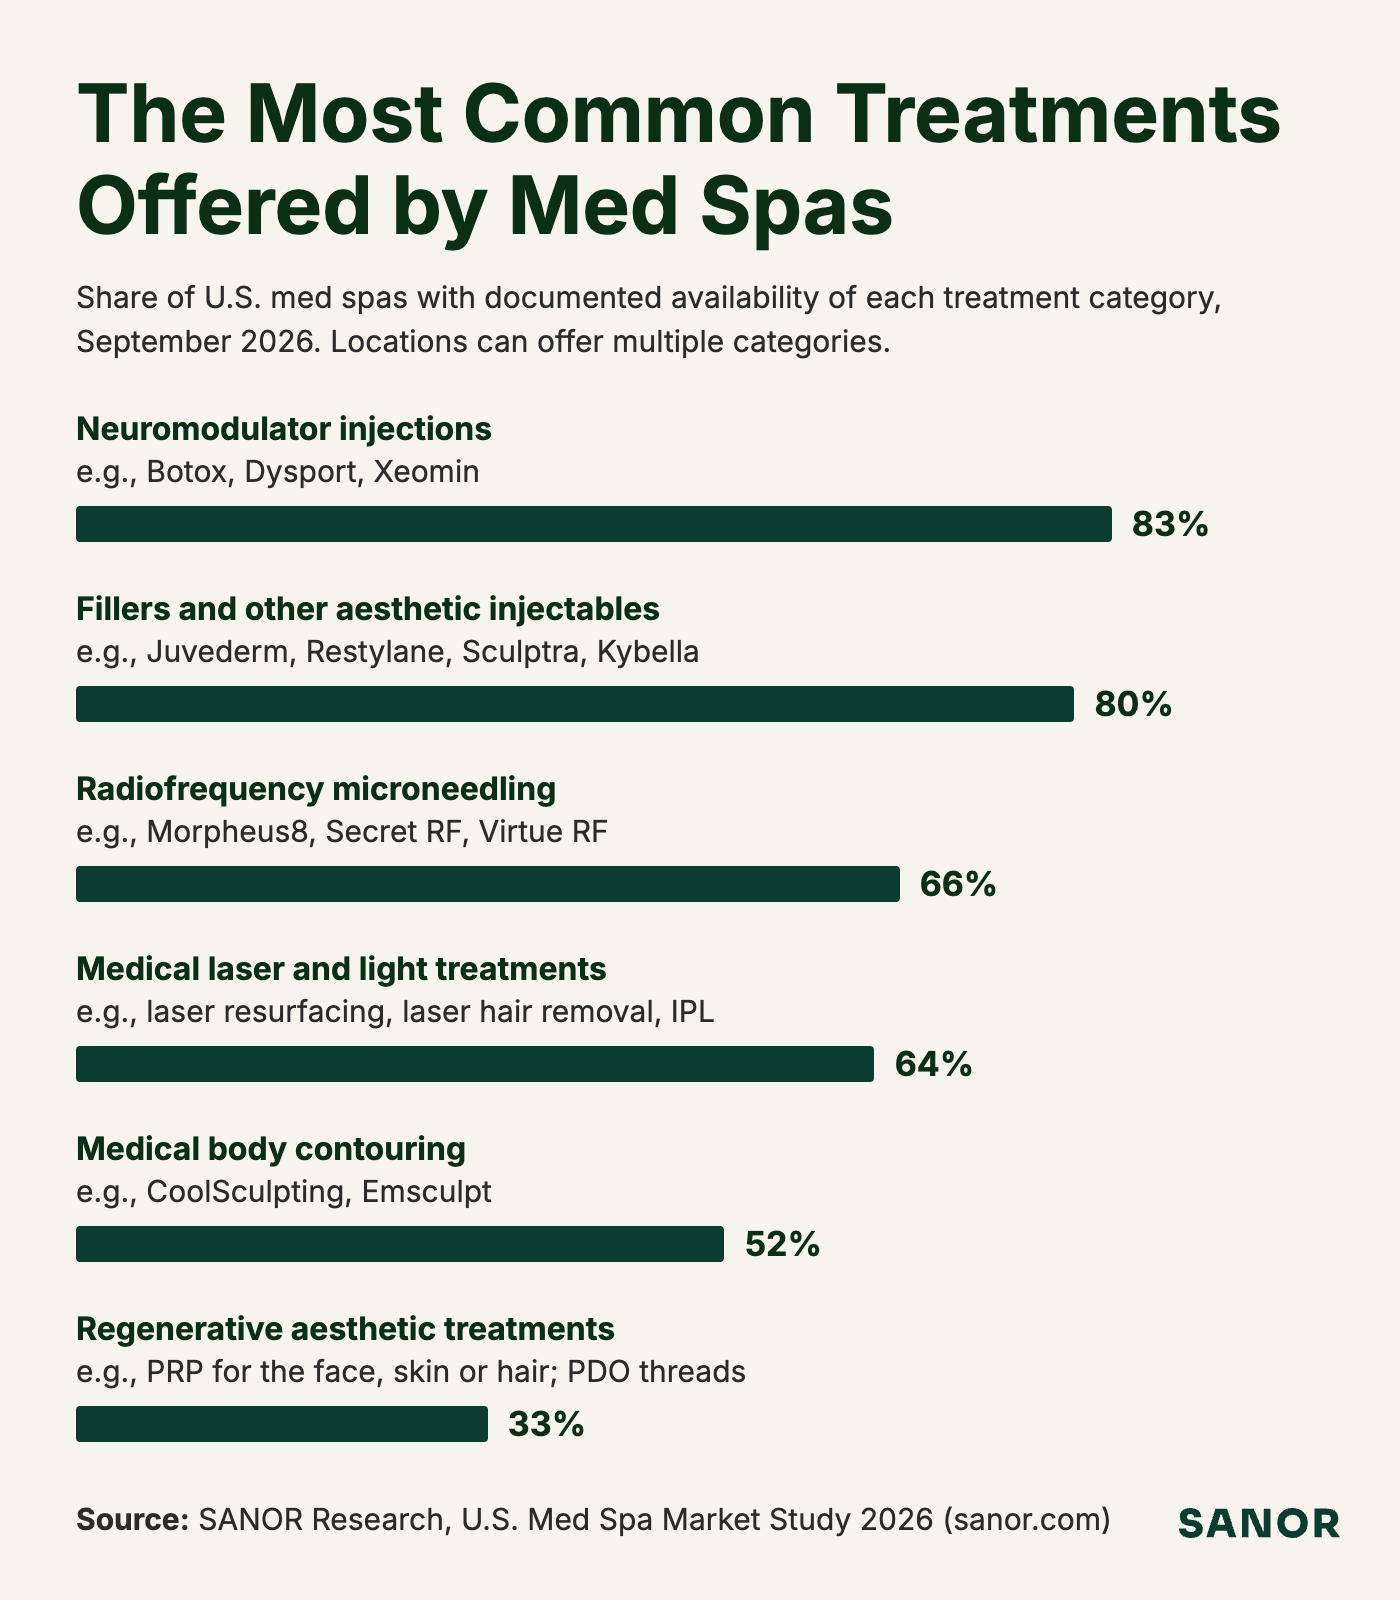
Neuromodulator injections are the most widely offered treatment
83% of med spas list neuromodulator treatments, such as Botox, Dysport or Xeomin. Fillers and other aesthetic injectables follow at 80%.
Show treatment dataHide table
| Treatment category | Med spas with documented availability |
|---|---|
| Neuromodulator injections (e.g., Botox, Dysport, Xeomin) | 83% |
| Fillers and other aesthetic injectables (e.g., Juvederm, Restylane, Sculptra, Kybella) | 80% |
| Radiofrequency microneedling (e.g., Morpheus8, Secret RF, Virtue RF) | 66% |
| Medical laser and light treatments (e.g., laser resurfacing, laser hair removal, IPL) | 64% |
| Medical body contouring (e.g., CoolSculpting, Emsculpt) | 52% |
| Regenerative aesthetic treatments (e.g., PRP for the face, skin or hair; PDO threads) | 33% |
These figures reflect treatments documented on clinic websites, service menus and booking pages. They measure availability, rather than treatment volume or revenue.
Locations can offer multiple categories, so the percentages exceed 100% when added together.
Nearly one-third document five or six treatment categories
The most common combination includes neuromodulators, fillers, laser or light treatments, RF microneedling and body contouring. This combination accounts for 18.6% of qualifying establishments with documented treatment offerings.
Another 14.3% list all five categories plus regenerative aesthetic treatments. Together, these two combinations represent 32.9% of establishments with documented offerings, indicating that broad treatment menus are common.
Percentages are weighted estimates based on documented treatment availability; services absent from a clinic’s public materials may not be captured.
Med Spa Revenue and the Size of the U.S. Market
Surveyed med spa locations forecast average annual revenue of $1.13 million in 2026
SANOR’s survey of 384 individual med spa locations puts their average annual revenue at $1.13 million for 2026, compared with $1.11 million reported for 2025. The rounded averages differ by $20,000 per location, an increase of approximately 2%.
| Revenue measure | Amount |
|---|---|
| Average annual revenue per location, 2025 | $1.11 million |
| Forecast average annual revenue per location, 2026 | $1.13 million |
| Increase in the reported averages | $20,000 |
| Percentage increase | Approximately 2% |
The 2026 figure is a full-year forecast. It reflects expected annual revenue rather than sales completed by the September research date.
SANOR surveyed 384 individual med spa locations in September 2026. Each response reported revenue for one location: actual revenue for 2025 and a full-year 2026 forecast based on performance to date.
These responses produced average annual revenue per location of $1.11 million for 2025 and a forecast of $1.13 million for 2026.
U.S. med spa revenue is forecast to reach $29.6 billion in 2026
SANOR forecasts a $29.6 billion U.S. med spa market in 2026, using its establishment estimate and revenue survey. The calculation applies the surveyed average as the national revenue benchmark:
26,171 locations × $1.13 million per location = $29.6 billion in annual revenue.
AmSpa’s 2024 industry report describes a U.S. market exceeding $17 billion. SANOR’s $29.6 billion forecast indicates a larger market in 2026, although the figures cover different periods and use different methods. The difference should not be read as a measured rate of market growth. AmSpa industry report
It also shows why market size and individual business performance need separate consideration: a large national revenue total can coexist with modest growth in average revenue per location.
Revenue survey: 384 individual locations. Percentage change and market revenue are calculated from rounded revenue averages.
Med Spas Face Growing Competition
The number of U.S. med spas grew 17% from 2025 to 2026, while forecast average revenue per location increased just 2%. More clinics are entering the market, but average sales per clinic are growing only modestly.
These findings suggest a transition from a gold rush to a more mature, competitive market. If customer demand does not keep pace with new openings, operators will increasingly need to capture market share to grow.
Performance will depend more on customer acquisition, conversion and retention, supported by clear differentiation and consistent treatment outcomes.
This could also drive consolidation, as stronger operators acquire clinics that struggle to compete. The market continues to offer opportunities, but industry growth alone will not be enough—individual operators’ ability to compete will increasingly determine their results.
What Counts as a Med Spa?
SANOR defines a med spa as an operating physical location whose primary business is nonsurgical medical aesthetics in a spa-like outpatient setting.
To qualify, a location must offer at least one treatment below and have documented involvement from a licensed medical professional, such as a physician, nurse practitioner, physician assistant or appropriately supervised registered nurse.
- Neuromodulator injections (e.g., Botox, Dysport, Xeomin)
- Dermal fillers and aesthetic injectables (e.g., Juvederm, Restylane, Sculptra, Kybella)
- Medical laser or light treatments (e.g., laser resurfacing, medical laser hair removal, IPL)
- Radiofrequency microneedling (e.g., Morpheus8, Secret RF, Virtue RF)
- Medical body contouring (e.g., CoolSculpting, Emsculpt, cryolipolysis)
- Regenerative aesthetic treatments (e.g., PRP for the face, skin or hair; PDO threads)
Excluded are ordinary spas and salons; massage, facial-only and ordinary-microneedling businesses; IV-only, wellness-only and weight-loss-only clinics; embedded aesthetics departments; training businesses, product sellers and closed locations.
Each qualifying location counts once, including individual branches of a chain. Duplicate listings and practitioner profiles within the same clinic are excluded.
How SANOR Conducted the Research
The study estimates the number of U.S. med spa locations operating in September 2026. Establishment estimates are based on sampled business records; revenue estimates draw on a separate survey of 384 individual locations.
Data sources and classification
Google Places provided the core pool of business records, supplemented by business directories and company location pages. Classification drew on clinic websites, treatment menus, booking pages and staff information.
Locations were assessed against four criteria: operating status, a primary focus on medical aesthetics, availability of at least one qualifying treatment, and documented involvement of a licensed medical professional.
The unit counted was the physical establishment. Each qualifying branch of a multi-location business was treated separately. Identified duplicate listings and practitioner profiles within another clinic were excluded.
Establishment estimation
Sample results were weighted by their probability of selection to estimate state and national totals. The published total of 26,171 is the model’s point estimate, reported as a whole number. Twelve states had dedicated samples. Estimates for the remaining 39 jurisdictions combined local sample results with pooled results from other states to account for smaller samples.
Classification review
Automated screening was followed by evidence review. A separate assessment involved two independent human reviewers examining 600 records without access to the original classifications.
Reviewer agreement was 95% before adjudication. Disagreements were resolved and the resulting classifications incorporated into the estimates. This agreement rate measures classification consistency; it does not establish the accuracy of the national total.
Measuring revenue
The revenue survey covered 384 individual med spa locations in September 2026. Each response concerned a single location’s revenue, including its reported 2025 revenue and a full-year 2026 forecast based on performance to date.
The survey provides an indicative revenue benchmark. It was not established as nationally representative, and the change in respondents’ average revenue does not measure growth across all U.S. med spas.
The market-size forecast is a rough estimate, calculated by applying the survey average to the estimated number of locations. A larger, more representative survey is needed to measure market size and growth more precisely.
Limitations and interpretation
The study provides estimates of market size, geographic distribution and treatment availability based on the sources and methods described above. Additional location verification can improve coverage and account for changes in business listings and clinic services.
State rankings indicate the relative size of markets. Larger local samples would improve precision, particularly where differences between states are small. The establishment estimate assumes that 50% of unresolved locations qualify; verification of this assumption and further validation remain to be completed.
The revenue survey provides a benchmark for estimating market value. A larger, nationally representative survey would allow more precise measurement of revenue and growth across the industry.
The findings also provide a basis for examining competition. Assessing demand and saturation in individual markets requires additional evidence on customer spending, treatment volumes and clinic capacity.
Sources and Citation
Sources and data
Location counts and treatment findings are from SANOR’s U.S. Med Spa Market Study 2026. The revenue findings are from its September 2026 survey of 384 individual med spa locations.
Population-adjusted rates use the U.S. Census Bureau’s Vintage 2025 population estimates for July 1, 2025. External industry comparisons use AmSpa’s 2024 report recap, June 2024 announcement and industry report page.
Citation and media contact
Suggested citation: SANOR Research, U.S. Med Spa Market Study 2026, September 2026.
Research and media enquiries: Jason Lee, PhD, Senior Researcher, Healthcare Markets, SANOR Research — lee@sanor.com.
Sanor publishes for general information. This publication is not medical, financial, or investment advice.
The Private Clinic Playbook
Grow revenue at each location and build a commercial model that can scale across a clinic group.
Sanor never sells your personal information. By providing this information you agree to Sanor’s Privacy Policy and Terms of Service.

SANOR research follows the principles of ISO 20252:2019 and the ICC/ESOMAR International Code on Market, Opinion and Social Research and Data Analytics, and is conducted in line with our Independence Policy. Our published reports follow our Editorial Standards.
SANOR research is funded through advisory engagements and research licensing. We do not accept vendor sponsorship, paid placement, or advertising.
All publications are provided for general information only. They do not constitute medical, financial, or investment advice and do not account for the circumstances of any specific business or individual.